
Since 2005, U.S. high school seniors have made slight gains in both their reading and math skills, according to new data released by the U.S. Department of Education. But progress has flatlined since 2009, reading scores are lower than they were in 1992, and significant achievement gaps also remain.
Though recent reports show the U.S. is graduating more high school students than ever before, the new data suggest that teens bound for college and careers on average fall short of a solid, or “proficient,” level of performance in reading and math. Just over a quarter of students scored at the proficient level in math, while a third hit that mark in reading.
The results come from an assessment measuring math and reading that was administered last year to some 92,000 12th-graders around the country. Known as the Nation’s Report Card, the National Assessment of Educational Progress (NAEP) is viewed by many experts as the gold standard for gauging student understanding of academic subjects.
Overview
In a statement, U.S. Secretary of Education Arne Duncan expressed concern that blacks, Hispanics and Native Americans far underperformed compared to whites and Asians. Blacks as a group averaged below-basic in math while Native Americans and Hispanics scored just above that threshold.
Still, the data show progress: Since 2005, math scores for African-Americans and Hispanics rose five and seven points, respectively, on a 300-point scale. Native American scores remained flat. Whites and Asian-Americans saw their scores grow by four and 10 points, respectively. Reading scores were either flat or rose for all demographic groups since 2005, but increased the most for whites and Asian-Americans — by four and nine points, respectively.
“Achievement gaps among ethnic groups have not narrowed,” Duncan said. “We project that our nation’s public schools will become majority-minority this fall – making it even more urgent to put renewed attention into the academic rigor and equity of course offerings and into efforts to redesign high schools.”
He added: “We must reject educational stagnation in our high schools, and as a nation, we must do better for all students, especially for African-American and Latino students.”
Peggy Carr, associate commissioner of the research agency that administers NAEP, cautioned that achievement gaps can mask improvements. “Yeah, we didn’t see any gap closures, and that’s because everyone [except for Native Americans] was going up,” she said. “We want gaps to close, but the only way that’s really going to happen when everyone is making progress is if students at the bottom of the distribution have to make greater gains.”
NAEP Scores and Predicting College Success
So how do NAEP scores of students on the cusp of graduating correlate with college success? The average math score for 12th-grade students was 153, below the score of 176 needed to be considered proficient. In 2009, a study attempted to link NAEP scores to SAT results, and found that reaching proficiency is roughly equivalent to scoring a 500 on the math portion of the SAT. The maker of the SAT, the College Board, indicates that a 500 score closely correlates with averaging a B- in first-year college courses. As with many studies linking one assessment to another, the translations are inexact. And a study earlier this year raised questions about using standardized tests to predict college performance, finding that high school grades better gauged postsecondary preparedness than SAT scores.
[Bonus Read: Can States Pay Students to Perform Better on NAEP?]
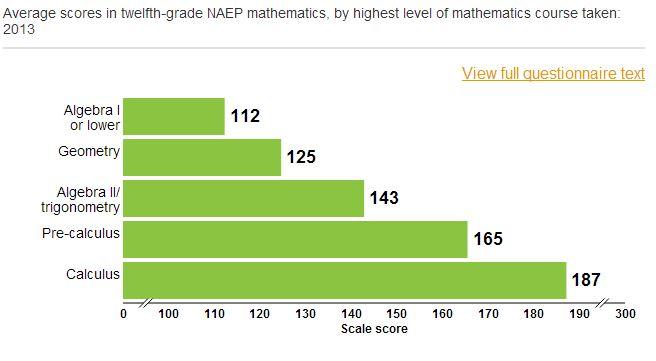
Yet student course-taking seems to correlate with how well they perform on NAEP, and depending on the researcher, how they may perform at a university. The chart below shows average scores for students according to the highest level of math they’ve completed.
But numerous reports have shown that African-Americans, Hispanics and lower-income students are much less likely to enroll in advanced math courses, and the trend begins at the start of high school. In 2009, half of the richest fifth of ninth-graders enrolled in a math course above the level of Algebra I, compared with fewer than 20 percent among students in the bottom fifth. Asian-Americans and whites also were more likely than blacks and Hispanics to take on a harder math course in ninth grade.
Demographics May Affect NAEP Results
Some of the changes in the 12th-grade results may be attributed to changes in who gets tested. John Q. Easton, director of the federal Institute of Education Sciences, notes that since 1992 the percentage of Hispanics in the U.S. at this grade level has tripled from 7 percent to 20 percent while the share of whites fell from three-quarters to just less than 60 percent.
The number of tested students with learning disabilities – a group that tends to underperform on standardized tests – doubled to 11 percent over that time period. Easton also said that even as the testing population grew in the past two decades, the number of students excluded from taking the test declined from 5 to 2 percent.
And because high school graduation rates have increased from 74 to 80 percent since 1992, the type of lower-performing students who might have left school in years past are now more likely to stick around until 12th grade. Graduation rates among certain minority groups in particular have made major gains: Since 2006, the high school graduation rate has climbed by 15 percentage points for Hispanics and by nine points for blacks, federal data show.
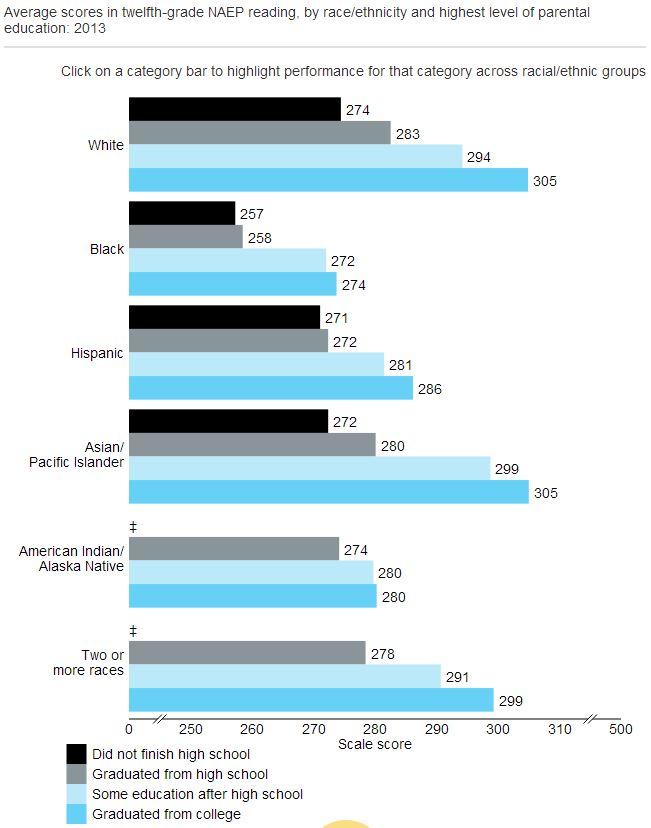
Students with more educated parents performed better on the latest 12th grade NAEP tests, though some demographic groups showed higher scores than others.
Scores by parent education in math (a proficient score is 176 out of 300 points):

And in reading (a proficient score is 302 out of 500):