The U.S. isn’t No. 1 but it’s in the top 10: According to a respected international measure of American student performance in math and science, the nation’s 4th and 8th graders, on average, scored higher than students in dozens of countries.
The results unveiled today are from the Trends in International Mathematics and Science Study (TIMSS), an international assessment given to roughly 580,000 students in more than 50 countries in 2015. The assessments have been measuring U.S. students and their international peers every four years since 1995 and use a statistical modeling technique to test students across all regions so that the scores are comparable. (Results from another global assessment that covers reading, math, and science are coming out Dec. 6.)
U.S. 8th graders performed as well or higher in math than all but eight countries or regions on TIMSS, entering a statistical tie with 10 other education systems while topping students in 24 countries or regions. (The assessment also sampled students in areas like Hong Kong and Ontario, Canada, in addition to independent countries). This is similar to 2011’s showing, when seven countries or regions demonstrated higher scores than the U.S. in 8th-grade math.
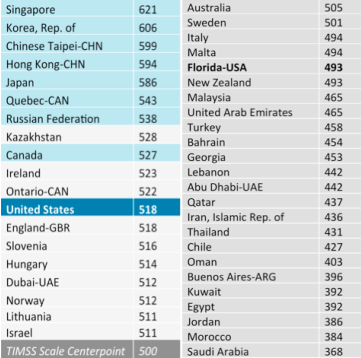
Eighth-Grade math scores (light blue means education systems scored higher than the U.S.; no shade means systems had statistically identical scores; greyed-out systems had statistically lower scores).
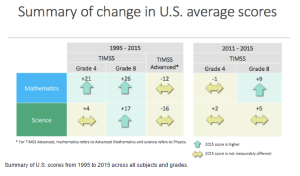
Because TIMSS assesses students separately in math and science – and by grade – there’s no one composite score. Still, depending on the grade and subject, U.S. 4th and 8th graders achieved scores that were typically better than most countries, tied with a few, and lower than students from a just a handful of other education systems, such as Japan and Russia in 8th-grade math and Slovenia and South Korea in 8th-grade science. A smaller batch of countries and regions — nine — took part in measuring how well their advanced math and physics students performed in their final year of high school. In math, U.S. scores were similar to Russia and Portugal and higher than five others.
These results shouldn’t make U.S. educators or policymakers overconfident, however. Scholars warn that compiling rankings and treating the results like sports standings represent poor uses of the assessments. Experts say it’s better to view the scores over time to determine whether U.S. students are improving or slipping relative to past years.
In that respect, the trends are positive. Since 1995, U.S. 4th and 8th graders have improved in math by 21 and 26 points, respectively. In science, 4th grade students have made no real gains in that time, while 8th graders in 2015 were up 17 points compared to their domestic peers from 1995. (For more context on the long-term results, check out Sarah Sparks’ take for Education Week.)
While the U.S. has made gains, other countries also showed improvement since 1995, sometimes dramatically. Slovenian 4th graders saw their scores rise by 78 points between 1995 and 2015; Portuguese 4th grade math students in that time improved by 99 points – pole-vaulting from “low” to “intermediate” according to TIMSS terminology.
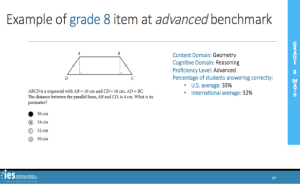
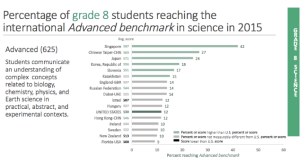
The mastery of the subjects varied by country, too. More than 40 percent of 8th graders in Singapore reached the “advanced” range of scores on the science portion. The same was true for 12 percent of U.S. 8th graders. It should be noted that Singapore is a city-state with 5.4 million people — roughly 2 percent the size of the U.S. population. In general, U.S. experts frown upon comparing countries to tested regions that are effectively cities.
Nor should TIMSS be compared to other major gauges of U.S. student performance. The National Assessment of Educational Progress (NAEP), which assesses students on a wide range of subjects every few years, actually showed a slight dip or no gains for 4th and 8th grade students in math from 2011 to 2015 and slight improvements in science between 2009 and 2015.
“Although these assessments are very similar in terms of the types of questions asked of the students, NAEP has more complexity to its questions than is the case for TIMSS,”said Peggy Carr, the acting commissioner of the National Center for Education Statistics, in a press call with reporters on Monday. She cautioned that while TIMSS shows how students are performing at a particular point in time, it can’t offer explanations as to why scores rose or fell.
That applies to international comparisons, too.
“Scholars are still debating and trying to figure out what is it that explains the fact that the Asian countries since the beginning of TIMSS in 1995 have consistently remained at the top and able to get such a high percentage of their students to the advanced benchmark level,” said Stephen Provasnik, a scientist at NCES who helps coordinate TIMSS.
The TIMSS results also tell a complicated story about America’s academic competitiveness globally. Scores on TIMSS are higher than U.S. performance on another international assessment called the Program for International Student Assessment (PISA), which measures math, reading and science skills among 15-year-olds. New PISA results are due out next week. In 2012 the U.S. placed 24th, 28th, and 36th in reading, math and science, respectively among 65 countries and regions. It’s this set of tests that lawmakers and pundits often refer to when decrying the purportedly poor state of U.S. public education. (For more on how to use the international test data, check out this EWA webinar.)
Testing experts say one key difference between PISA and TIMSS – other than the age of the students tested – is that TIMSS is more aligned with what students learn in school. PISA, on the other hand, seeks to gauge how well students can apply math, science and reading to real-world applications. “One cannot calculate what percentage of one’s income is going to housing without a clear understanding of how proportions work,” prominent education scholar William Schmidt of Michigan State University wrote in 2014 to explain why U.S. PISA scores tend to be lower.
And countries that take part in PISA tend to be wealthier and have lower child poverty rates than the students in the U.S. and many of the TIMSS countries. Nonetheless, Finland, a perennial heavyweight on PISA, scores lower on TIMSS in some subjects and grade levels.
How the test results are used is also a point of frustration for scholars.
“Very often you’ll hear from politicians that there was a golden age when the United States led the world in math testing,” said Tom Loveless, an education scholar at the Brookings Institution. “That’s simply not true.” The first-ever international math comparison of countries was issued in 1963 – the U.S. placed 11 out of 12. But the tenor at the time was less outrage and more acceptance. The Washington Post in 1967 quoted experts who said America’s relatively low ranking was to be expected, a departure from the current raft of pitched press releases from think tanks and elected officials who blame America’s middling performance on any number of structural problems within U.S. education.
Loveless takes issue with public policy anxiety over international assessments, saying readers should be suspicious of statements that call such results “Sputnik” moments. “Actually we got our wake-up call in the United States in 1967, so if we’re not awake by now I’m not sure when we will be,” he said.
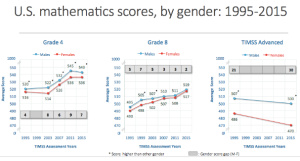
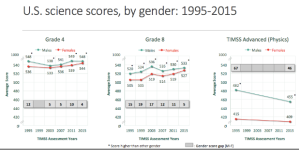
Finally, the gap between U.S. boys and girls narrowed or disappeared in all subjects but advanced math, according to the 2015 TIMSS results. Carr said one possible explanation for the wider gap in the advanced courses may be that girls are less likely than boys to take the most challenging math courses.