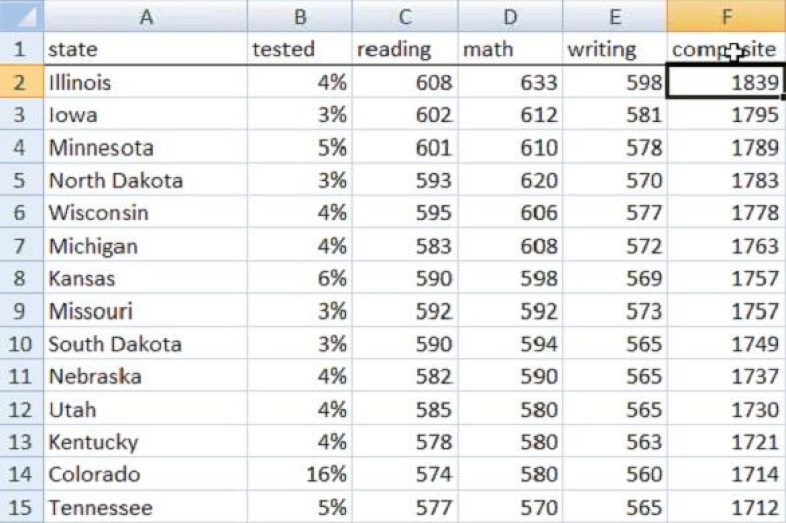

With SAT scores coming out today, we thought it would be a good time to feature this November, 2011 webinar that explores some of the reasons SAT scores can fluctuate year-to-year. You’re likely familiar with at least one of them: as more students take the SAT, the growing share of students poorly prepared for college will bring down average scores.
Holly Hacker, a Dallas Morning News reporter, crunched the numbers and found participation rates can account for up to 82 percent of a state’s average SAT score. The webinar presentation also cautions against comparing your state to others.
Last year, Wisconsin education officials sent out a press release lauding its students for placing above the national average. Texas, meanwhile, buried the state’s average scores in its press release, likely because of lackluster results. But the sample sizes weren’t even close: the land of cheese had a participation rate of just four percent, compared to Texas’ 54 percent. While not etched in stone, traditionally lower participation rates mean only the most prepared students take the SAT.
As more states mandate a college entrance exam like the SAT or ACT as part of the battery of tests necessary to graduate, look out for surprising swings in student performance. The sample size is likely to explain a good deal of the fluctuation.
You can find Hacker’s webinar here.