Word on the Beat: Adversity Score
What reporters need to know about the College Board’s experimental “Environmental Context Dashboard”
What reporters need to know about the College Board’s experimental “Environmental Context Dashboard”
The question of which students should win admission to selective colleges is so heated that it has sparked state legislation, discrimination lawsuits and a celebrity-studded bribery scandal. So news that the College Board had been providing admissions officers data on the kind of “adversity” to which applicants had been exposed couldn’t help but stir controversy.
In this installment of “Word on the Beat,” we explain what the College Board’s “Environmental Context Dashboard” is, how the dashboard is being used, and why it is controversial. (EWA also has posted a Q and A with College Board officials about the dashboard.)
What it means:
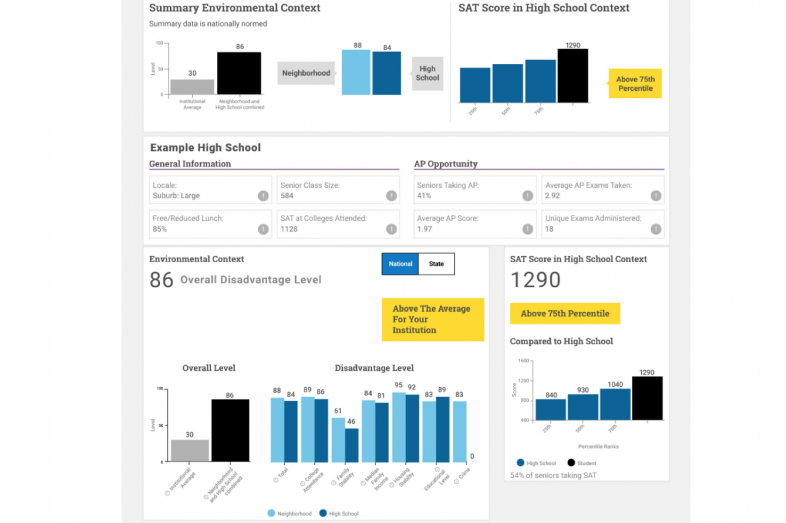
In the fall of 2017, the College Board started piloting an Environmental Context Dashboard (ECD) as a supplement to its SAT scores. It provided admissions officers with at least 15 data points about each applicant’s neighborhood and high school to put the applicant’s SAT score in context. The data points include factors such as crime rates, poverty indicators and educational levels for the Census tracts surrounding the student’s home and high school.
The College Board also combines all the data points for each student into a single measure to summarize the overall level of “environmental challenge” to which the student was, supposedly, exposed. Students in wealthy neighborhoods who attend top-notch high schools might get a 0. Students who live in low-income neighborhoods and attend schools in troubled communities might get a 100.
The dashboard does not reflect students’ personal characteristics such as their race, gender, disabilities, etc. Because the measure is based on the general environment, students who live in the same Census tract and attend the same high school have identical dashboards, even if one may be, say, living in a homeless shelter and receiving special education services, and another is an honors student from a two-parent household. (Of course, each applicant’s individual characteristics are reflected in the student’s accompanying college application.)
Some observers have dubbed this measure an “adversity score,” but David Coleman, the CEO of the College Board, objects to that term for two reasons. In an interview with EWA, he said that instead of reflecting“adversity,” he believes the dashboard tries to indicate the student’s “resourcefulness.” In addition, he said the ECD measure is not a “score,” because it can’t be changed by individual study or practice. The Merriam-Webster dictionary defines “score” as “a number that expresses accomplishment (as in a game or test) or excellence (as in quality) either absolutely in points gained or by comparison to a standard.”
As of this writing, the College Board does not reveal to individual students their ECD data. But College Board officials told EWA that they are considering making the data public.
Why it matters:
The College Board plans to increase the beta test of the ECD from 50 schools to 150 in the fall of 2019. Depending on the feedback from those colleges, the organization says it may expand its distribution even further in 2020.
A study by University of Michigan researcher Michael Bastedo found that providing college admissions officers with information about a student’s educational and socioeconomic context can boost the enrollment of students from disadvantaged backgrounds.
Some officials from schools that are already using the ECD say the dashboard is simply a tool that makes it easier to do what they were already doing – evaluating applicants in context – and has helped them enroll more disadvantaged students. John Barnhill, an assistant vice president for enrollment management at Florida State University, said his admissions officers already had their own incomplete notes on the quality of high schools. But “there’s no way you can visit every high school in the country.” Thanks to the ECD, ”we now have consistent data.”
Florida State, one of the first 50 schools to try out the dashboard, saw enrollment of students of color rise five percentage points after adopting the tool. While other efforts could have fueled the expanded diversity, Barnhill said he believed the ECD “certainly contributed” to it.
But there is also a danger the ECD could have problematic, unintended consequences. “Any factor runs the potential for doing harm,” Barnhill acknowledged. “You could say, ‘Hey, I don’t want to bring in someone unless they can pay their full tuition.’”
And some critics worry about the imprecision of the measure. Some theorized that high-income families could game the tool by moving into low-income neighborhoods, for example.
Who’s talking about it:
Parents, students, counselors, and admissions officers.
In addition, the Environmental Context Dashboard has also drawn attention from partisans on all sides of the debate over the use of affirmative action in college admissions. Some are critical because the ECD does not consider race. Meanwhile, anti-affirmative action activists worry that the index will be used as a proxy for race.
Want to know more?
The College Board has posted a data summary of the Environmental Context Dashboard. And you can watch a College Board information session.
Inside Higher Ed was one of the first publications to write about the tool. Some of the current controversy appears to have been sparked by a Wall Street Journal article. The Chronicle of Higher Education has also covered the issue extensively.
Correction: This article was amended to correct a statement about the College Board’s methodology for calculating the summary measures.
Word on the Beat” is a regular feature of The Educated Reporter. Send your suggestions to erichmond@ewa.org.
Your post will be on the website shortly.
We will get back to you shortly